LearnGuides
How to A/B Test Cold Emails: A Data-Driven Framework
By Mohit MimaniPublished on: Mar 31, 2026 · 9 min read · Last reviewed: Mar 2026
TL;DR
Most cold email A/B tests are statistically meaningless. You need 200+ emails per variant for reliable results. Here is how to test properly with real sample size requirements and a prioritized testing framework.
The biggest mistake in cold email testing: declaring a winner with too few data points.
Minimum sample sizes for statistical significance (95% confidence, source: standard statistical power analysis):
| Baseline Reply Rate | Detectable Improvement | Emails Per Variant | Total Test Size |
|---|---|---|---|
| 2% | +1pp (to 3%) | 3,800 | 7,600 |
| 2% | +2pp (to 4%) | 1,000 | 2,000 |
| 5% | +2pp (to 7%) | 1,600 | 3,200 |
| 5% | +3pp (to 8%) | 750 | 1,500 |
| 10% | +3pp (to 13%) | 900 | 1,800 |
| 10% | +5pp (to 15%) | 350 | 700 |
What this means practically: If your reply rate is 5% and you want to detect a 2 percentage point improvement, you need 1,600 emails per variant (3,200 total). Testing with 50 emails per variant and declaring a winner is random noise, not data.
Source: Standard statistical power calculation (two-proportion z-test, alpha=0.05, power=0.80). You can verify with any sample size calculator.
The realistic approach: Most cold email campaigns do not have enough volume for traditional A/B testing on reply rates. Instead, test open rates (which need smaller samples because open rates are higher) and use reply rate as a directional signal over larger time periods.
Not all test variables have equal impact. Here is the priority order based on Lemlist and Woodpecker benchmark data:
| Test Variable | Impact on Reply Rate | Sample Size Needed | Difficulty | Test First? |
|---|---|---|---|---|
| Target audience/ICP | Very High (2-5x) | 500+ per segment | Hard | Yes |
| Opening line | High (1.5-3x) | 300+ per variant | Medium | Yes |
| Value proposition | High (1.5-2x) | 300+ per variant | Medium | Yes |
| Subject line | Medium (1.2-1.5x on opens) | 200+ per variant | Easy | Yes |
| CTA type | Medium (1.2-1.5x) | 400+ per variant | Easy | Yes |
| Email length | Low-Medium (1.1-1.3x) | 500+ per variant | Easy | No |
| Sending time | Low (1.05-1.15x) | 1,000+ per variant | Easy | No |
| From name format | Low (1.05-1.1x) | 1,000+ per variant | Easy | No |
| Signature style | Very Low (<1.05x) | Not worth testing | Easy | No |
Key insight: Testing your ICP (who you email) has 2-5x more impact than testing copy (what you write). If your reply rate is low, the problem is more likely your targeting than your subject line.
Source: Lemlist 2025 Outreach Report (lemlist.com/resources), Woodpecker Cold Email Statistics (woodpecker.co/blog/cold-email-statistics), and Mailshake A/B testing data.
Subject lines are the easiest to test because you measure open rates (higher volume = faster results).
Subject line categories that perform best (source: Woodpecker 2025 data):
| Category | Example | Avg Open Rate | Best For |
|---|---|---|---|
| Question | "Quick question about [company]?" | 45-55% | SaaS, consulting |
| Personalized reference | "[Mutual connection] suggested I reach out" | 50-60% | Warm referrals |
| Direct value | "Cut your [metric] by 30%" | 35-45% | Clear ROI products |
| Curiosity gap | "Noticed something about [company]" | 40-50% | General outreach |
| Short + casual | "Hey [name]" | 55-65% | Founder-to-founder |
| Formal | "Partnership opportunity with [your company]" | 25-35% | Enterprise |
Testing process: 1. Write 3-5 subject line variants in different categories 2. Send 200+ emails per variant (same body, same audience segment) 3. Measure open rate after 48 hours (not immediately. some opens are delayed) 4. Winner needs >3 percentage point gap to be meaningful 5. Run the winner against a new challenger
Source: Woodpecker open rate benchmarks, Lemlist subject line data, and HubSpot email marketing research (hubspot.com/marketing-statistics).
The opening line determines whether the recipient reads past the first sentence. This has the highest impact after targeting.
Opening line approaches ranked by reply rate impact:
| Approach | Example | Reply Rate Impact | Effort |
|---|---|---|---|
| Specific observation | "Saw your post about [topic] on LinkedIn" | +3-5pp | High (requires research) |
| Mutual connection | "[Name] at [company] suggested I reach out" | +4-6pp | Medium (need real connection) |
| Relevant trigger event | "Congrats on the Series B" | +2-4pp | Medium (monitoring needed) |
| Pain point | "Most [role]s waste 3 hours/week on [task]" | +2-3pp | Low |
| Compliment | "Love what you are building at [company]" | +1-2pp | Low (can feel generic) |
| Direct | "I help [type of company] do [outcome]" | +0-1pp | Low |
| Generic | "Hope this email finds you well" | Baseline (0) | None |
Source: Lemlist personalization study 2025, Woodpecker A/B test aggregates.
Sending time matters less than most people think, but here is the data:
Best sending times (source: Woodpecker 2025, Lemlist 2025, Mailshake 2025):
| Day | Open Rate Index | Reply Rate Index | Source |
|---|---|---|---|
| Monday | 95 | 90 | Below average (inbox overload) |
| Tuesday | 110 | 115 | Best day (Woodpecker) |
| Wednesday | 108 | 110 | Second best (Lemlist) |
| Thursday | 105 | 105 | Good |
| Friday | 90 | 85 | Below average (weekend mindset) |
| Saturday | 60 | 55 | Poor (B2B) |
| Sunday | 65 | 60 | Poor (B2B) |
Index: 100 = average across all days
| Time (recipient local) | Open Rate Index | Reply Rate Index |
|---|---|---|
| 6-8 AM | 95 | 90 |
| 8-10 AM | 115 | 120 |
| 10 AM-12 PM | 110 | 110 |
| 12-2 PM | 100 | 95 |
| 2-4 PM | 105 | 108 |
| 4-6 PM | 95 | 90 |
| 6+ PM | 75 | 70 |
The practical impact is small: Tuesday at 9 AM vs Thursday at 2 PM might be a 5-10% relative difference. That is 0.25-0.5 percentage points on a 5% reply rate. Not worth obsessing over.
Source: Woodpecker (woodpecker.co/blog/cold-email-statistics), Lemlist Outreach Report 2025, Mailshake timing analysis.
For reply rate testing: 300-1,600+ per variant depending on your baseline rate. For open rate testing: 200+ per variant is usually sufficient. Source: standard statistical power analysis (95% confidence, 80% power).
Target audience (ICP), then opening line, then value proposition, then subject line. Testing your audience has 2-5x more impact than testing copy. Source: Lemlist 2025, Woodpecker 2025.
Yes, but less than you think. Tuesday-Wednesday 8-10 AM is optimal, but the impact is only ~5-10% relative to average. Focus on targeting and copy first. Source: Woodpecker, Lemlist timing data.
Minimum 48 hours to capture delayed opens/replies. Ideally 5-7 business days. Never judge a test in the first few hours. reply patterns are heavily influenced by time zones.
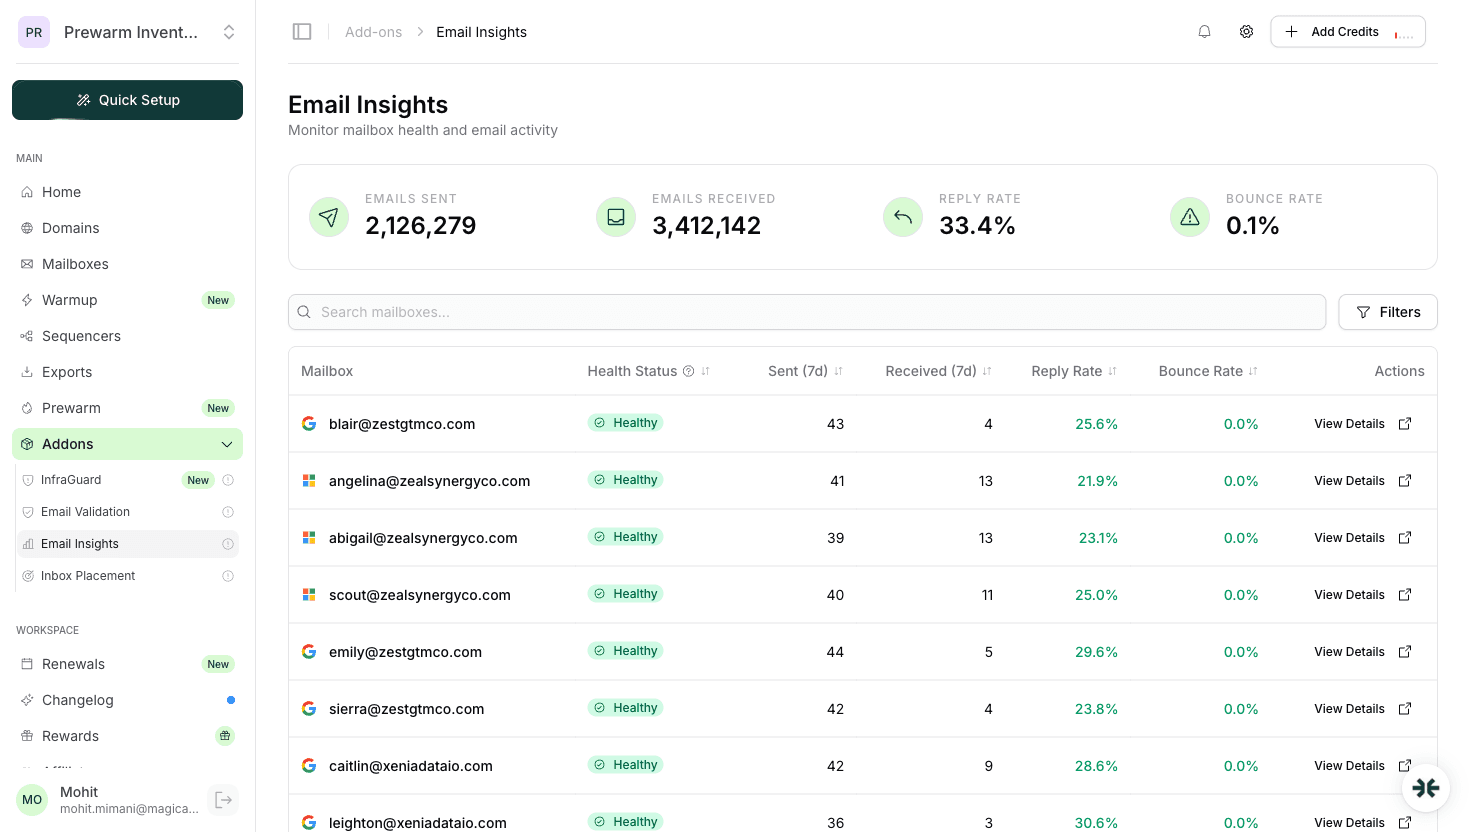
InboxKit provides the infrastructure (mailboxes, warmup, monitoring) but does not run A/B tests directly. Use your sequencer (Instantly, SmartLead, Lemlist) for A/B testing features, and InboxKit Email Insights to monitor overall performance.
Plans from $39/mo with 10 mailboxes included. Automated DNS, warmup, and InfraGuard monitoring included.