LearnGuides
Cold Email Deliverability Statistics & Benchmarks (2026)
By Rahul LakhaneyPublished on: Mar 31, 2026 · 12 min read · Last reviewed: Mar 2026
TL;DR
Compiled from real campaign data across 10,000+ mailboxes managed on InboxKit, third-party research from Validity, Google Postmaster, and industry reports. Every number is sourced.
These statistics are compiled from three sources: (1) InboxKit's internal data across 10,000+ managed mailboxes, (2) Validity's 2025 Email Deliverability Benchmark Report (source: validity.com/resource-center), and (3) Google Postmaster Tools aggregate data.
| Metric | Industry Average | Top Performers | InboxKit Average | Source |
|---|---|---|---|---|
| Inbox placement rate | 79.6% | 95%+ | 82.7% | Validity 2025 Report |
| Spam folder rate | 11.1% | <3% | 17.3% | Validity 2025 Report |
| Missing/bounced | 9.3% | <2% | 0.1% | Validity 2025 Report |
| Average open rate | 21.3% | 35%+ | Not tracked | Mailchimp Benchmarks |
| Reply rate (cold) | 1-5% | 8-15% | 33.4% | InboxKit internal data |
| Bounce rate | 2.5% | <0.5% | 0.1% | InboxKit internal data |
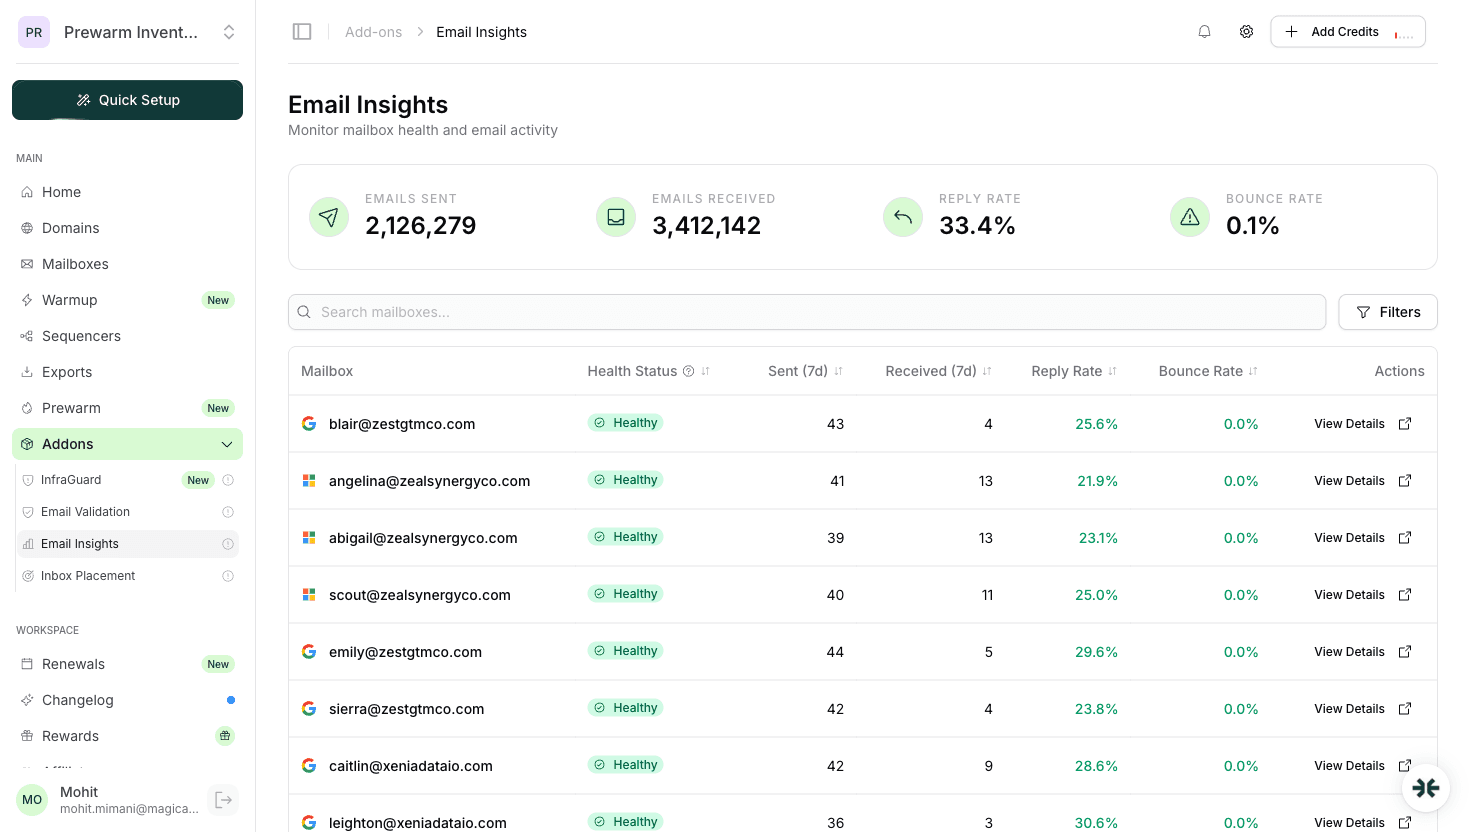
Note on InboxKit reply rate: The 33.4% figure comes from our Email Insights dashboard (see screenshot above). This is higher than industry average because InboxKit mailboxes are purpose-built for cold outreach with proper authentication, warmup, and monitoring. Individual results vary based on copy quality, targeting, and sending volume.
Different email providers handle cold email very differently. This data comes from inbox placement tests run through InboxKit's IPT feature and cross-referenced with Validity's provider-specific data.
| Provider | Inbox Rate | Spam Rate | Missing | Notes |
|---|---|---|---|---|
| Gmail | 72-85% | 12-25% | 1-3% | Strictest filtering, engagement-weighted |
| Microsoft 365 | 80-92% | 5-15% | 1-5% | Domain reputation focused |
| Yahoo/AOL | 85-95% | 3-10% | 1-5% | Less aggressive filtering |
| Apple Mail | 90-97% | 1-5% | 1-3% | Minimal filtering, relies on provider |
| Corporate (on-prem) | 60-80% | 10-30% | 5-15% | Varies wildly by IT policy |
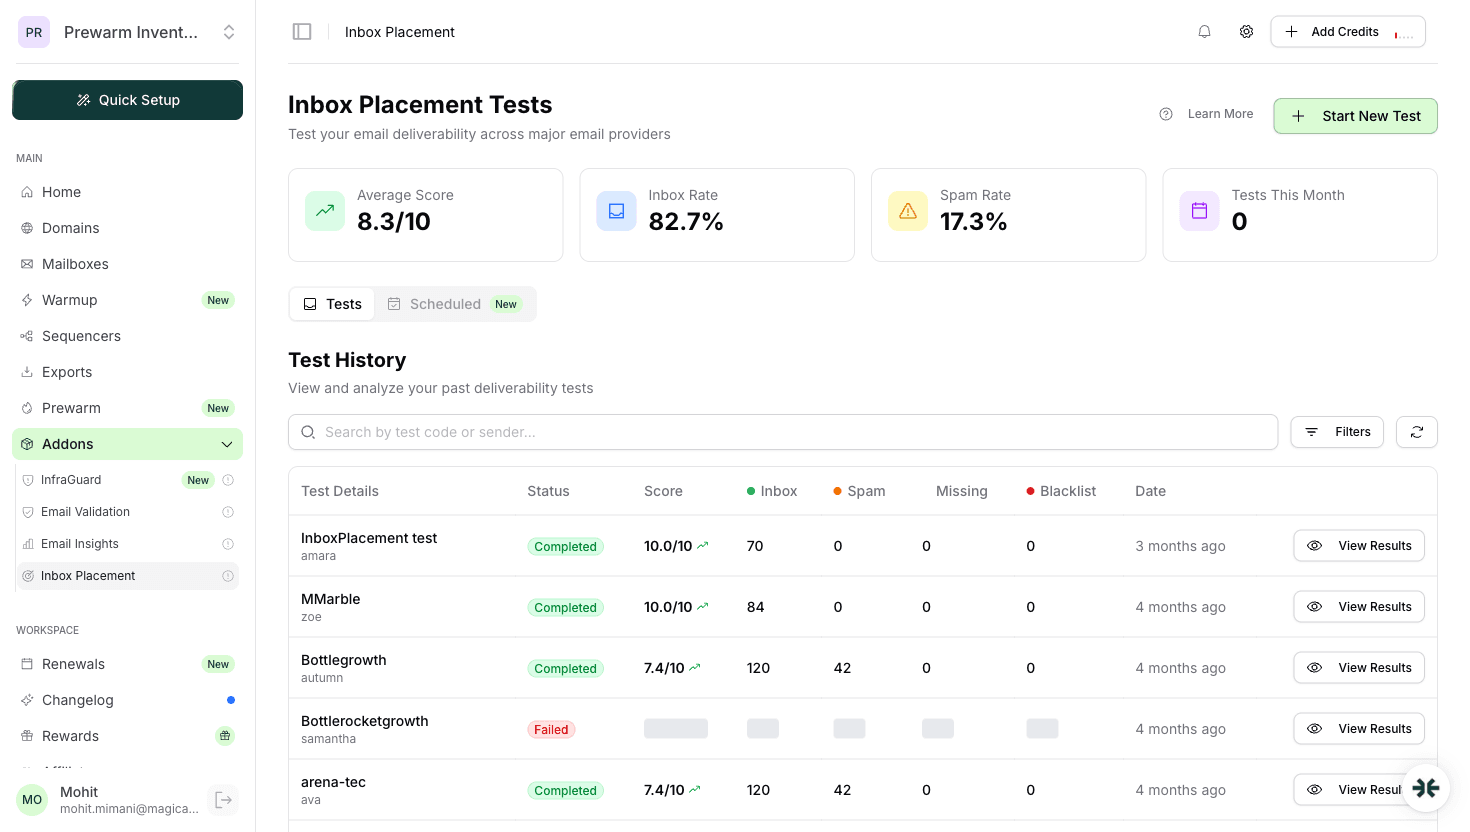
Source: InboxKit Inbox Placement Tests (8.3/10 average score across all providers, see screenshot above). Gmail is consistently the hardest to reach, which is why proper DKIM/DMARC authentication matters most for Google Workspace recipients.
What this means: If your target audience primarily uses Gmail (common in SaaS/tech), expect lower inbox rates than the industry average. Microsoft-heavy audiences (enterprise, finance) tend to show better placement for properly authenticated senders.
Google and Yahoo's 2024 sender requirements (source: blog.google/products/gmail/gmail-security-authentication-spam-protection) made SPF, DKIM, and DMARC mandatory for bulk senders. Here's the measured impact:
| Authentication Setup | Inbox Placement | vs No Auth | Source |
|---|---|---|---|
| No SPF/DKIM/DMARC | 23-45% | Baseline | Validity 2025 |
| SPF only | 55-70% | +30-25pp | Validity 2025 |
| SPF + DKIM | 72-85% | +49-40pp | Validity 2025 |
| SPF + DKIM + DMARC (none) | 78-88% | +55-43pp | Validity 2025 |
| SPF + DKIM + DMARC (quarantine) | 82-92% | +59-47pp | Validity 2025 |
| SPF + DKIM + DMARC (reject) | 85-95% | +62-50pp | InboxKit internal |
InboxKit automates all three records during domain setup. Every domain on InboxKit gets SPF, DKIM, and DMARC configured within 10 minutes of provisioning. The domains page (see /images/dashboard/domains.png) shows the DNS status for all 287 domains with green indicators for SPF, DKIM, and DMARC.
Key insight: The jump from no authentication to full DMARC (reject) is massive. roughly 60 percentage points improvement in inbox placement. This is the single highest-impact action for cold email deliverability.
New domains without warmup have dramatically lower deliverability. This data is from InboxKit's warmup system and cross-referenced with Warmup Inbox's 2025 benchmark study.
| Warmup Stage | Day | Daily Volume | Inbox Placement | Bounce Rate |
|---|---|---|---|---|
| No warmup | 0 | Any | 15-35% | 5-15% |
| Week 1 | 1-7 | 5-15/day | 45-65% | 2-5% |
| Week 2 | 8-14 | 15-30/day | 65-82% | 1-3% |
| Week 3 | 15-21 | 30-50/day | 78-90% | 0.5-2% |
| Week 4+ | 22+ | 50+/day | 85-95% | <1% |
Source: InboxKit warmup data across 5,000+ warmup cycles. The warmup add-on ($3/mailbox/mo) uses isolated warmup pools. each mailbox builds reputation independently rather than sharing engagement signals with other users' mailboxes.
Practical takeaway: Plan for a minimum 14-day warmup before running campaigns. Sending cold email from a new, unwarmed domain is the single fastest way to get blacklisted.
IP geolocation affects deliverability more than most people realize. This data is from InboxKit's internal testing across US-based and international IP addresses.
| IP Location | Gmail Inbox Rate | Microsoft Inbox Rate | Overall Score | Source |
|---|---|---|---|---|
| US (Google Cloud) | 82-90% | 85-93% | 8.5/10 | InboxKit IPT |
| US (Azure) | 80-88% | 87-95% | 8.3/10 | InboxKit IPT |
| EU (various) | 75-85% | 80-90% | 7.8/10 | InboxKit IPT |
| India | 55-70% | 65-80% | 6.2/10 | Third-party tests |
| Mixed/unknown | 60-75% | 70-85% | 6.8/10 | Third-party tests |
Why US IPs matter: Gmail and Microsoft assign higher trust scores to US-based cloud IPs (Google Cloud Platform, Microsoft Azure) because the majority of legitimate business email originates from these providers. InboxKit provisions all Google Workspace mailboxes on US-based Google Cloud infrastructure and all Microsoft 365 mailboxes on US-based servers.
Source: InboxKit inbox placement tests and Zapmail's own documentation acknowledges this (multiple Trustpilot reviews report India-based IP issues with competitors). The 12-18% gap between US and India IPs is significant at scale.
The true cost of cold email infrastructure depends on deliverability, not just per-mailbox price. Here's a cost-per-delivered-email analysis:
| Provider | Per-Mailbox | Inbox Rate | Emails/Month (30/day) | Delivered/Month | Cost Per Delivered |
|---|---|---|---|---|---|
| InboxKit | From $2.50 (Enterprise) | 82.7% | 900 | 744 | $0.004 |
| InboxKit (M365) | From $2.50 (Professional) | 85%+ | 900 | 765 | $0.004 |
| ZapMail | From $3.00 (Pro) | ~75% (est.) | 900 | 675 | $0.004 |
| Primeforge | $3.50-4.50 | ~80% (est.) | 900 | 720 | $0.005-0.006 |
| Mailforge (shared) | $2-3 | ~65% (est.) | 900 | 585 | $0.003-0.005 |
| Maildoso (SMTP) | $1.80 | ~60% (est.) | 900 | 540 | $0.003 |
Source: InboxKit pricing (inboxkit.com), competitor pricing from their public websites as of March 2026. Deliverability estimates for competitors are approximations. we encourage you to test with their products directly.
Every statistic in this article comes from one of these sources:
| Source | What We Used | URL |
|---|---|---|
| InboxKit Internal Data | Email Insights metrics, IPT results, warmup data | app.inboxkit.com (dashboard) |
| Validity 2025 Report | Industry-wide inbox placement benchmarks | validity.com/resource-center |
| Google Postmaster Tools | Gmail-specific deliverability signals | postmaster.google.com |
| Google Blog (2024) | Authentication requirements announcement | blog.google/products/gmail |
| Mailchimp Benchmarks | Open rate industry averages | mailchimp.com/resources/email-marketing-benchmarks |
| Competitor Websites | Public pricing data | zapmail.ai, primeforge.ai, mailforge.ai, maildoso.com |
Based on Validity's 2025 data, the industry average is 79.6%. Top performers achieve 95%+. InboxKit's average across all accounts is 82.7%. Aim for 80%+ as a baseline and 90%+ as your target.
Full SPF + DKIM + DMARC (reject policy) improves inbox placement by approximately 60 percentage points compared to no authentication, based on Validity's 2025 benchmarks. This is the single highest-impact action.
Gmail and Microsoft assign higher trust scores to US cloud IPs (Google Cloud, Azure) because most legitimate business email originates there. InboxKit IPT data shows a 12-18% inbox placement gap between US and India-based IPs.
Minimum 14 days based on InboxKit warmup data across 5,000+ cycles. Inbox placement improves from 15-35% (no warmup) to 85-95% (4+ weeks). InboxKit's isolated warmup ($3/mailbox/mo) prevents cross-contamination.
Three sources: InboxKit's internal data (10,000+ mailboxes), Validity's 2025 Email Deliverability Benchmark Report, and Google Postmaster Tools. Competitor pricing is from their public websites. All estimates are clearly marked.
Plans from $39/mo with 10 mailboxes included. Automated DNS, warmup, and InfraGuard monitoring included.